BRDC, Admin BRDC, Admin

The Blue Ridge: A Geological Autobiography

If the Blue Ridge could write its own long and complex history, surely it would chisel the words in stone. Fortunately, it did just that. And fortunately, we have a translator in our midst. During our January 2019 Geology Expedition, USGS Geologist Arthur Merschat unraveled the story of the geologic events that left Virginia’s oldest basement rocks exposed for us to access and admire.

If the Blue Ridge could write its own long and complex history, surely it would chisel the words in stone. Fortunately, it did just that. And fortunately, we have a translator in our midst. During our January 2019 Geology Expedition, USGS Geologist Dr. Arthur Merschat unraveled the story of the geologic events that left Virginia’s oldest basement rocks exposed for us to access and admire.

Geology Expedition 1.26.19 DSC05134.jpg

The Blue Ridge Mountains as we see them today are a result of several major geologic events. Initially, tectonic plates drifting together over time caused continental collisions during the Grenville orogeny and produced the supercontinent Rodinia around 1 billion years ago. Around 750 million years ago, Rodinia began to break up and caused a series of lava flows and volcanic eruptions. The final breakup resulted in the pulling apart of the continent and the formation of oceans, and for a time, Virginia existed as a tropical marine environment located south of the equator. Evidence of this can be seen in the fluvial to marine sedimentary rocks of the Chilhowie Group along Whitetop Rd. However, during the Alleghenian orogeny 300 million years ago, Africa collided with us to form the supercontinent Pangea. This event thrust billion-year-old basement rocks and 750 million-year-old volcanic rocks of Mount Rogers above the layered rocks of the Valley & Ridge. It is these ancient, metamorphosed rocks that we encountered on our trip.

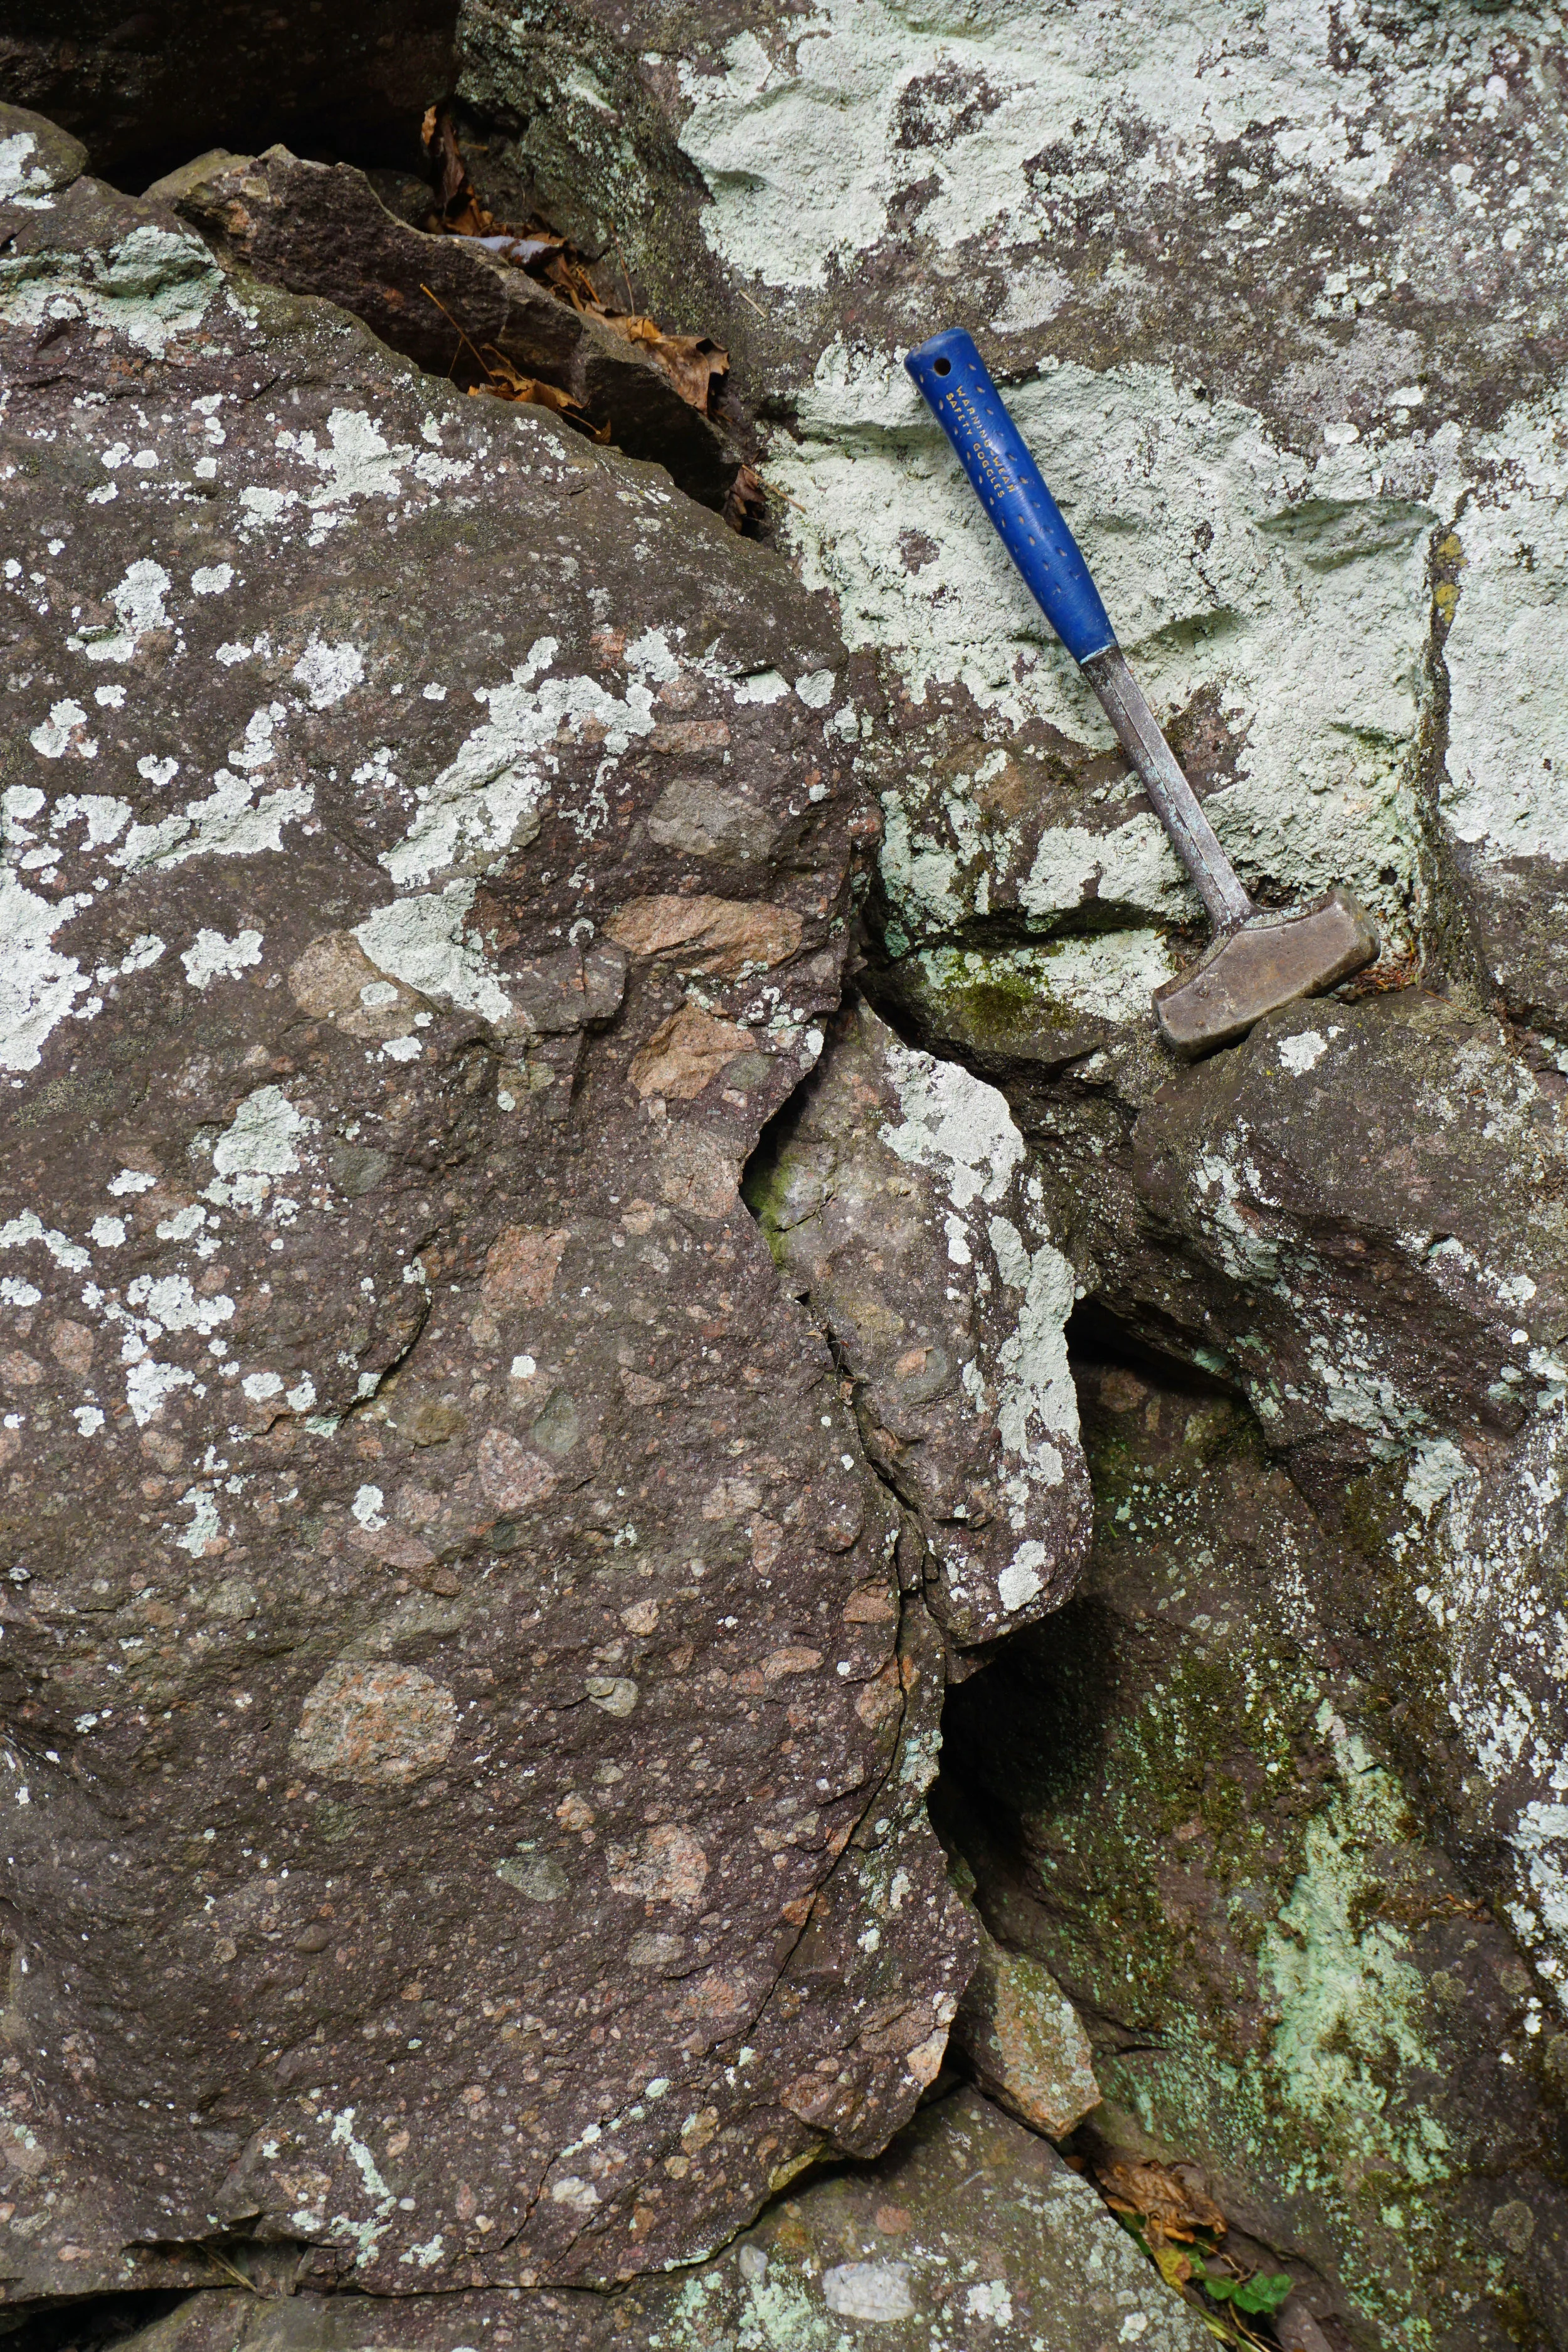
Matrix-supported diamictite with hammer for scale.

Matrix-supported diamictite with hammer for scale.

The trip began with a visit to a road cut of 750 Ma diamictite (pictured) within the Konnarock Formation. This sedimentary rock consists of clasts (pieces of rock or minerals that range from pebbles to cobbles and boulders) supported by a matrix of sand and clay and tells us that this area was once a glacial environment.

Our next stop within the Konnarock Formation provided an opportunity to spot dropstones. During glacial melt, granite stones that had been carried in the ice dropped into the soft sediment (rhythmite and laminite) of the lake beds.

Next, we ventured north on Whitetop Rd. to view elements of the Unicoi Formation within the Chilhowie Group, where a 540 Ma basalt flow is easily visible within a road cut on Iron Mountain. From north to south it is possible to see the basalt flow with conglomerate, arkose, and shale below, and quartzite above. During metamorphism, vesicles - former gas bubbles within the volcanic rock (basalt) - were filled with other minerals such as potassium feldspar and calcite. These filled vesicles are referred to as amygdules (pictured).

In this chunk of basalt with potassium feldspar amgydules, Dr. Arthur Merschat tests for calcite using hydrochloric acid.

In this chunk of basalt with potassium feldspar amgydules, Dr. Arthur Merschat tests for calcite using hydrochloric acid.

Black slate in the Hampton Formation.

Black slate in the Hampton Formation.

Our next stop was the Hampton Formation at Skulls Gap on Whitetop Rd. Here, an underwater landslide occurred while the black shale (formed in an anoxic environment) and sandstones were deposited, which were later metamorphosed into slate and quartzite (pictured).

Heading across Whitetop Mountain and along the Stone Mountain Fault, several stops allowed us to view rocks within the Mount Rogers volcanic center, including flow-banded lava, arkose, and volcanic breccia, as well as greenstone featuring phenocrysts of plagioclase (large, conspicuous crystals of plagioclase feldspar), and more amygdules, this time filled by epidote and quartz. Next, we encountered the Buzzard Rock member, the lowest and oldest rhyolite in the Mount Rogers volcanic center at over 755 million years old.

Geologist Dr. Arthur Merschat describes the greenstone at Elk Garden.

Geologist Dr. Arthur Merschat describes the greenstone at Elk Garden.

Phenocrysts of plagioclase embedded in greenstone.

Phenocrysts of plagioclase embedded in greenstone.

Potassium feldspar and plagioclase phenocrysts in the Buzzard Rock rhyolite.

Potassium feldspar and plagioclase phenocrysts in the Buzzard Rock rhyolite.

Once we crossed over the Catface Fault into the Pond Mountain volcanic center, we encountered mylonite, a fine-grained fault rock containing muscovite which had been lineated due to shearing and flattening.

Mylonite with lineated muscovite along the Catface Fault.

Mylonite with lineated muscovite along the Catface Fault.

Farther up the road, we glimpsed a peek at the 1.1 billion-year-old basement rocks within the Stone Mountain thrust sheet. These coarse, whitish-gray and pink granite rocks contain minerals that were crystalized deep in the earth’s crust before the formation of the Blue Ridge Mountains.

Our final stop at a road cut afforded us a wide view of the large clasts of rhyolite, granite, and arkose that comprise this boulder conglomerate. Beautiful!

Participants admiring a road cut of boulder conglomerate.

Participants admiring a road cut of boulder conglomerate.

The Geology Expedition was a full-day adventure of traveling through and unraveling millions of years of the Blue Ridge’s history. And although we only encountered a fraction of what there is to see, we ultimately acquired a deeper understanding of the geologic events that created this montane region*, the very foundation of our Center.

*If you are interested in learning more about the natural history of this unique region, join us for the Spring Mt. Rogers Naturalist Rally May 10-12, 2019.

Members FREE, Non-members $10


Trip Photo Gallery


Read More
Science Projects BRDC, Admin Science Projects BRDC, Admin

Students Study Whitetail Deer impact on forest understory

Through the cooperation of Matthews State Forest and forester Zack Olinger, and along with Alan Webb (Ag teacher), and Rachelle Rasco (stem lab manager) from Carroll County High School, BRDC initiated a research project at one of the two deer exclosure sites on MSF. This project is expected to encompass not only this fall semester, but also a spring 2016 return visit or two for further comparisons.

Through the cooperation of Matthews State Forest and forester Zack Olinger, and along with Alan Webb (Ag teacher), and Rachelle Rasco (stem lab manager) from Carroll County High School, BRDC initiated a research project at one of the two deer exclosure sites on MSF. This project is expected to encompass not only this fall semester, but also a spring 2016 return visit or two for further comparisons.

On August 21st, Evan Worrell and Scott Jackson-Ricketts (from Blue Ridge Discovery Center) gave a brief introductory explanation to the students about the project and what to expect. We handed out a research model, and encouraged them to familiarize themselves with the steps involved.

On September 9th, the 13 students arrived on a bus and joined Evan and Scott for a day of plant investigations. We also had on hand Dr. William Dunson whose experience in plant identification and deer plot studies proved to be of great help.

The practice of establishing deer exclosures dates back to at least the 1930s, and has been used to study the long term effects of deer browsing on forests. The basic approach is to choose a site that includes room for both the exclosure and control plots. Size of the plots is determined by proper and available space. 25% direct sunlight is required for both plots. The exclosures are fenced off from deer but are accessible to the research teams.

Our research goals are to follow guidelines of scientific inquiry which include building hypotheses based on early discussions about forest habitat and successional growth. We separated the students into four teams and divided the 32 square foot plots into four sections, assigning one group to one section each both inside and outside the exclosures. 

The research process involves adhering to an agreed upon series of protocols. Mapping out both plots into grids for detailed studies is essential. Data collection and documentation are the driving components. Type of tree cover, living or dead, descriptions of overstory (canopy) and understory growth including stumps, measurements of trunk diameter at approximately three feet from ground level, as well as total height of trees have been noted. Types of vegetation are broken down into these categories: trees, woody shrubs, herbaceous, graminae (grasses) and miscellaneous. Cover percentage of each vascular plant species was determined by means of a sampling frame, and numbered on the grid. 

On our first field day, we spent some time going over the layout, measuring tree diameters and heights, describing the canopy and familiarizing ourselves with our field guide library. Then we went about attempting to identify all of the plants, and counting species populations. It was quickly noted that inside the exclosure, more plants were thriving compared to the control plot that was fully available to browsing deer.

Zach closed the day’s activities with a summation of Matthews State Forest’s management goals, processes and tied that to the issues facing foresters through the white tail deer’s expanding impact on tree seedling survival…especially our native oaks. 

For our second field trip, held on October 21st, (more than a month later), we concentrated on improving our ID skills as well as making a greater effort on securing an accurate population count. Evan directed the students to rotate, giving each quadrant a much more thorough investigation. This intentional redundancy proved to be a most valuable tool and led to a higher degree of accuracy. We did find differences between our two investigations, and surmised that some of the smaller plants might not have been visible under the leaf litter until fall winds blew the leaves away.

Through the encouragement of Dr. Dunson, (now in Florida), Evan employed the Simpson Index for cataloguing and assimilating our data…which were entered into a spread sheet from which graphic analysis became more available and easier to understand. The Simpson Index takes into account total species diversity. Evan and Scott returned to the high school on November 17th to share the results of the students’ hard work, and to explain our accumulative findings. There were some surprises.


Read More